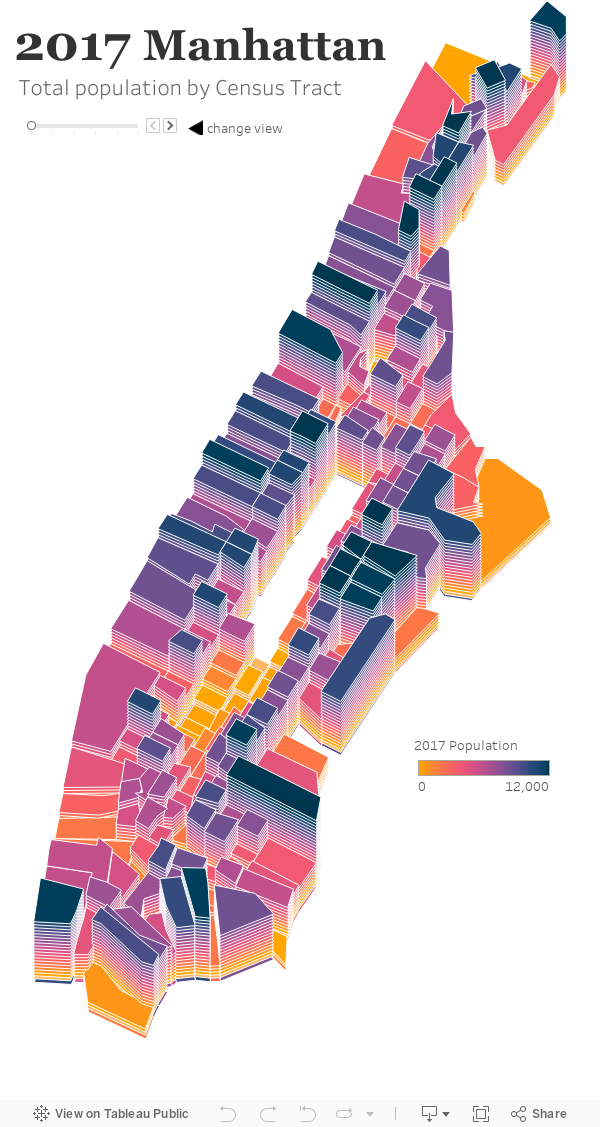

3D Maps in Tableau
This is a 3D map of Manhattan census tracts showing population by race in 2017. To create this 3D maps in Tableau it doesn't require any data pre-processing or densification changes. Just a good deal of layering and patience. See more details below.
The way to create this is to create a polygon map not using geospatial layers. These are just polygons. First I create a base map that is not filtered and doesn't show population. It just shows the bounds of the tracts. Then I layer 17 map layers on top of these. Each layer is filtered to showing a higher and higher level of population. The layers are then overlaid on top of one another as transparent sheets. Then they are slightly offset vertically. This creates the effect of a z-axis in Tableau.