


Layers in Tableau 2020.4
This is the presentation from my webinar: Using Layers in Tableau 2020.4. You can download the workbook here. Please comment below if you have any questions.
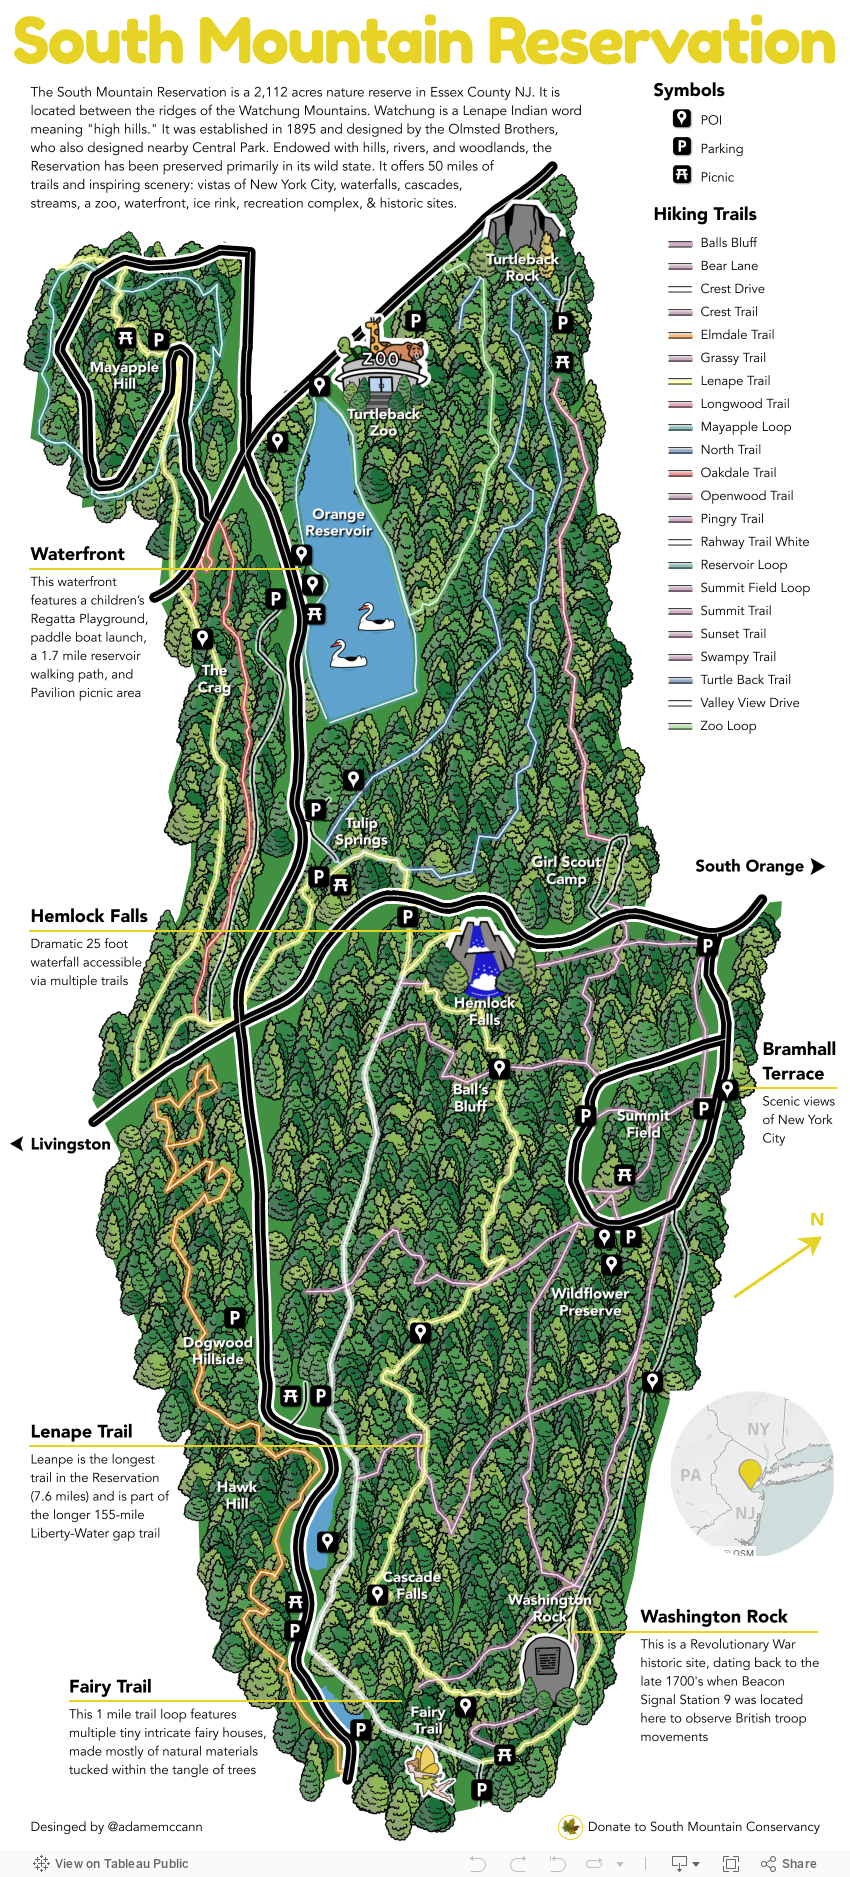
Zoomable Dashboard
With Tableau 2020.4 you can add multiple layers onto a single worksheet. This has opened up a number of possibilities. One is the ability to zoom into specific charts within a single dashboard. Sometimes a dashboard element is too small to explore easily. Zooming using parameter actions helps. See below.

It was kind of possible to do this in the past but with parameter actions and collapsible containers it is a little messy. Download and explore.