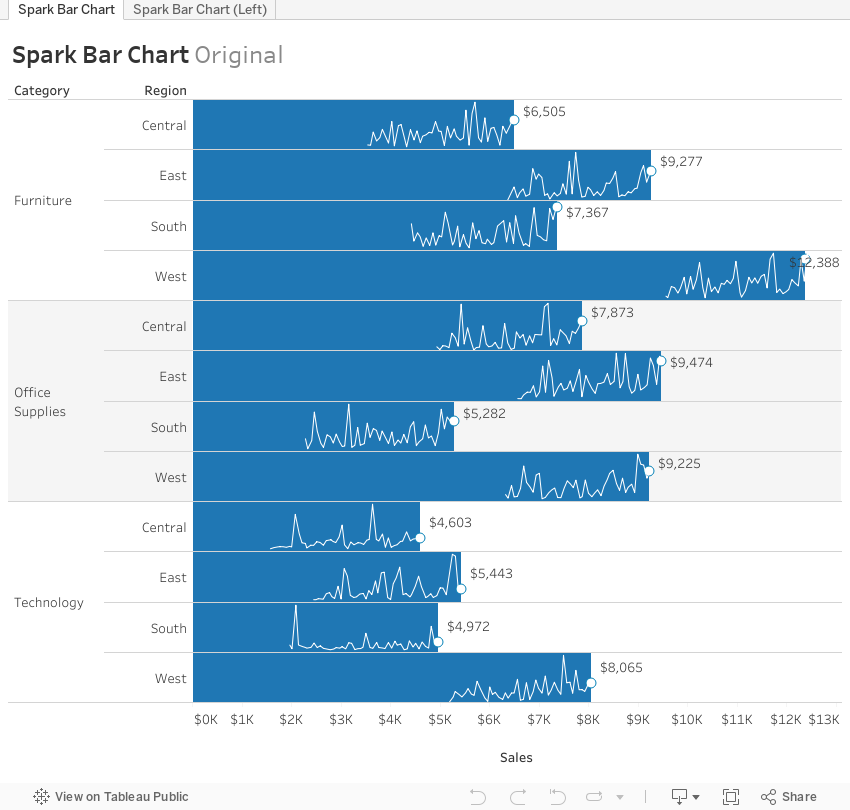
The height of the end point on the sparkline visualizes current value relative to height of the bar which represents the range of values across previous months. See an annotated version below.
Strengths
- Contains a high data to ink ratio
- Provides historical context or trend relative to a current point
- The primary visual weight is still a bar chart which is easy to interpret
- It is fun to say: spark bar chart, spark bar chart... do it, it's fun
Weaknesses
- If the bar is too short a sparkline would be impossible to see
- It is visually dense and difficult to understand for some audiences
Here are steps for creating this chart in Tableau. For this example I used the Superstore Sales data set. First, add your dimensions and sparkline measure to the row shelf.
Drag a combined field to the Details shelf if you are using multiple dimensions such as Category and Region above. I called my combined dimension CR. Also drag Order Date to the Details shelf. You will need these for a table calculation later.
Then, create your x-axis which I called Sales X. This is the sum of sales for the last period (Current Sales) plus 2 times the date value (Order Date). 2 is not required but depends on the measure you use. This creates the sparkline points starting at the current value. See the calculation for Current Sales further down.
Drag Sales X to columns shelf and then set the Table Calculation values. Select Specified Dimensions: your combined dimension (CR) and the sparkline date value (Order Date). Select at the Deepest level and Restarting at the combined dimension (CR).
Mark sure marks is set to Line. Edit the y-axis (Sales) to be independent axis ranges for each row or column. Then edit the x-axis (Sales X) to not start at zero. You should have something that looks like this.
Next drag Current Sales to the left of Sales X in the column shelf. Current Sales is just the sales value for the most current period. See calculation below.
Set the mark type to circle. Format the circle so it matches the line color (white) with a border. Add a reference line to the Current Sales axis. Set the scope at the Per Cell level, set the value to Current Sales and Average. Set No Label or Line. Then add a Fill Below color. This creates the bar in the spark bar chart.
Finally set the axis to a dual axes and you should have something that looks like this.
Let me know if you have any questions in the comments below. Thanks.
fantastic !!
ReplyDeletethank u
DeleteOutstanding idea. Have you thought of making the spark lines left aligned to allow for easier comparisons?
ReplyDeleteOooh good idea. I will try that tonight. Thanks.
DeleteHow did you determine 2 is the correct to use as your Denom? Is there a math calculation behind it?
ReplyDeleteConfusing and difficult.
ReplyDeleteThe bar widths are all the same, but represent different values. The horizontal axis has no connection to the sparklines. Keep the sparklines separate from the bars, with their own axis information and plot them as XmR charts.
Thanks for the feedback.
DeleteThe bar widths represent the range or min and max over time for that bar or dimension. So the width should be the same. The purpose of this visual is firstly to focus the audience on a comparison of a single point (current sales) across dimensions (the bars). Then, less importantly the performance of that bar over time within one dimension. Not a comparison of multiple points over time.
Most of the time we're looking to understand comparisons which the bar chart does, but often the very next question is "what's the trend" For those that find the two charts together somewhat confusing, would it be possible to pop-up the spark chart on a hover event?
DeleteI guess I am not understanding the problem that this attempts to solve, or the value that it provides.
ReplyDeleteMuch more clear to simply add the spark lines in a separate column to the right of the bars where they can be compared much better and without disrupting the view of the bars.
Thanks Jamie. Good point.
DeleteThe differences between this and a side by side sparkline in a separate column is the 1) primary message and 2) the visual weight.
The primary message of this visual is firstly a comparison of a single point (current sales) across dimensions (the bars). Then, less importantly the performance of that bar over time within one dimension. Not a comparison of multiple points over time like in a side column sparkline.
Secondly, most side bar sparkline charts give equal visual weight to the sparkline and the bar chart. In the spark bar chart the primary visual weight is the bar chart and the sparkline is secondary. A reference point like in a bullet chart. This aligns better with the purpose of this chart.
Thanks again.
I noticed when I try to do the table Calc - I don't have the option to use the combined field. This is in 10.0.1. Is there a difference in the new 10.1? (I haven't had the chance to test it in Tableau Public yet to get newest Version to try or see your WB)
ReplyDeleteI just tried it and had the same issue. You need to create the combined field manually - just concatenate the strings as new calculated field. Then it works.
Deletecan you please provide this workbook am not able to open this workbook
ReplyDeleteand this is my link (mahesh.glance@gmail.com) please provide this workbook
Not sure why you can't open workbook. Here is file: https://public.tableau.com/profile/adam.e.mccann#!/vizhome/SparkBarChart/SparkBarChart
DeleteI think that this is a beautiful way to show both trends over time and current values - it utilizes the space so well. Thank you for sharing!
ReplyDelete