Tertiary Data Encodings
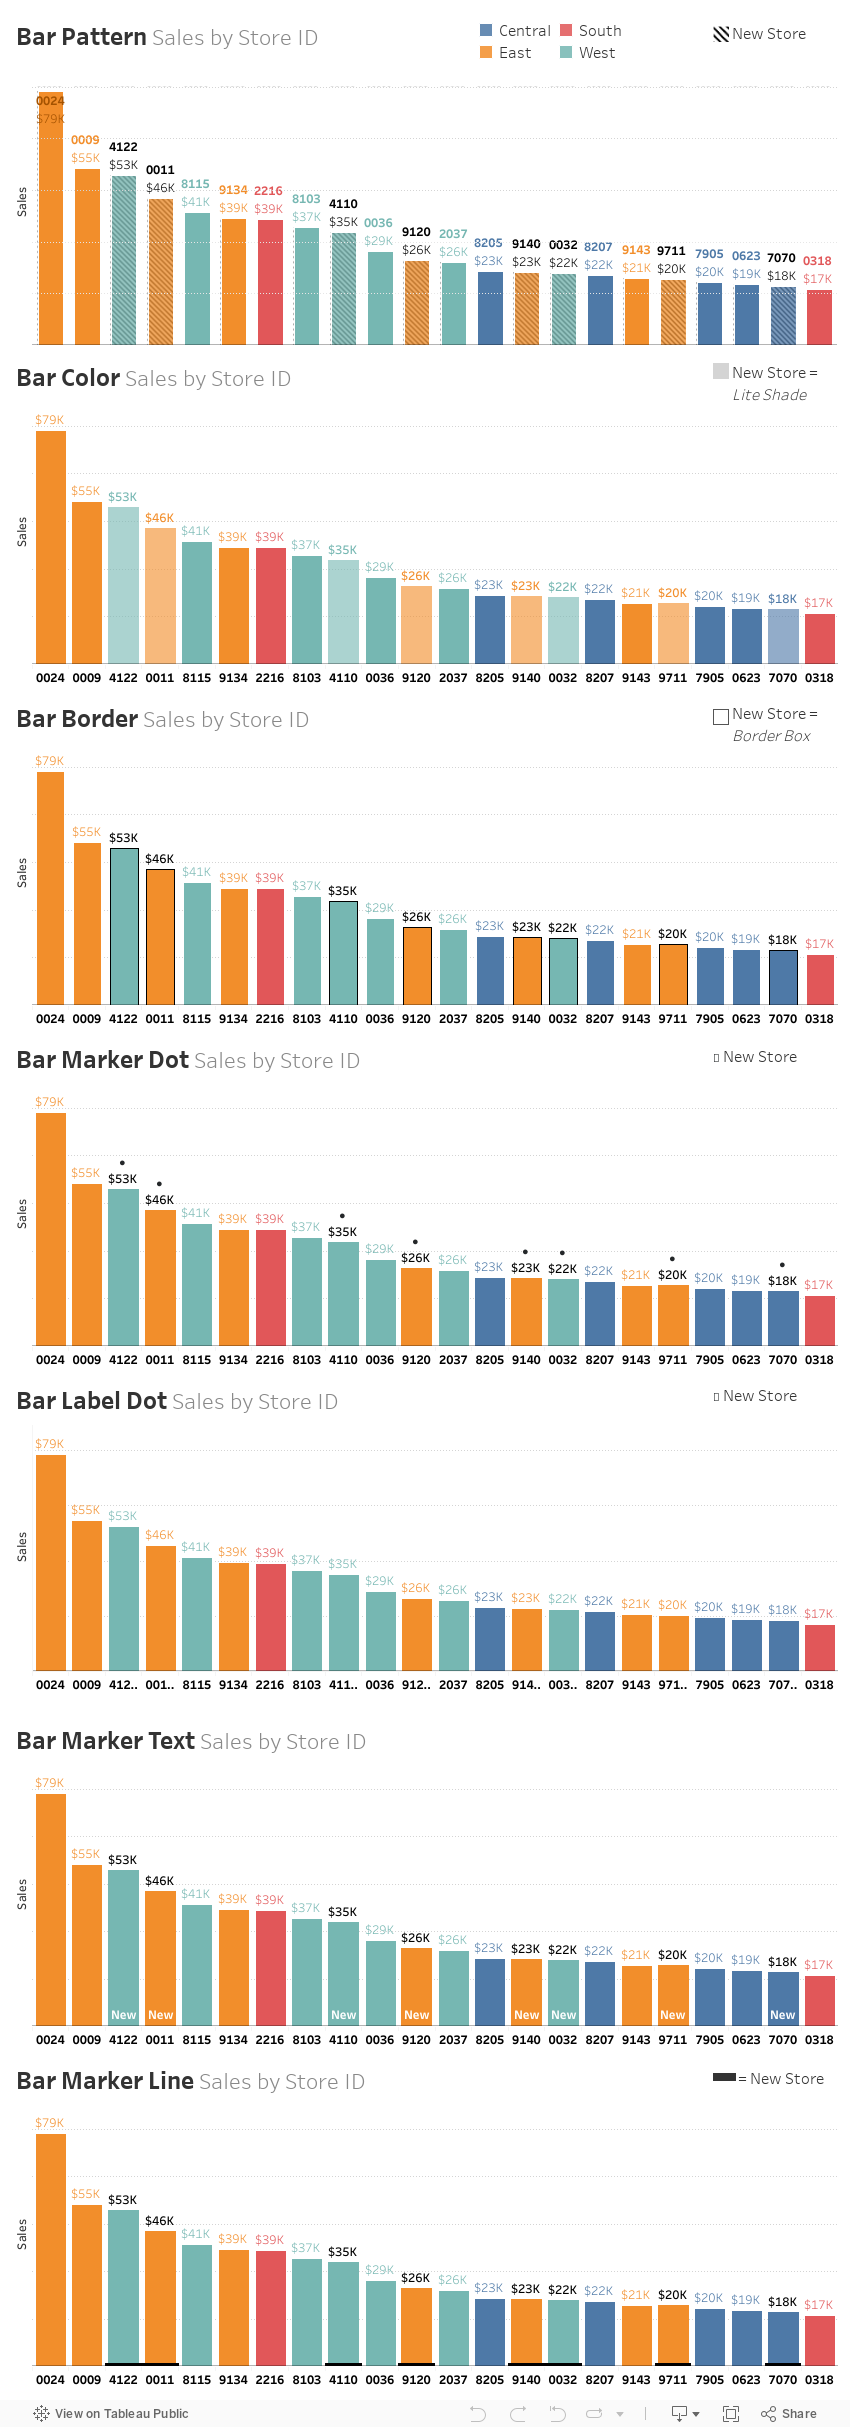
I recently posted about using fill patterns as a tertiary data encoding option in Tableau. By that I mean fill patterns can be used to communicate the third most important message in a chart. In this case the 1st most important message is sales by store. The 2nd most important is region. And the 3rd most important is whether the store is new or not. This is the least important message to communicate in the chart.
Here are a few other options to show tertiary data encodings on bar charts. UPDATED: Added the label dot option thanks to Steve Wexler's suggestion.

div#ContactForm1 {
display: none !important;
}