
The Marimekko slope chart is good for showing a comparison of discrete variables (bar chart), the population or size of these variables (bar width) and the trend of this discrete variable over two time periods (slope). The following visualization of the Presidential
The chart above provides new insights no other single other chart type could easily provide. Below are more details on this chart type, the value it provides, and more examples.
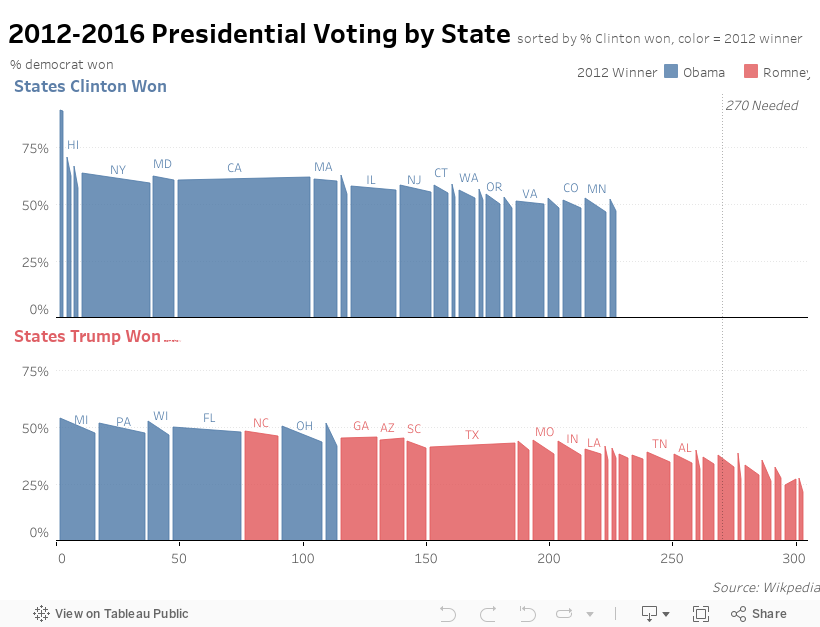
This chart shows, in order of importance and readability, the following information: 1) what percentage of each state voted for a democrat (bar), 2) each state's number of 2016 electoral votes (stacked bar) and 3) the change from 2012 to 2016 (slope). The row indicates which 2016 candidate won the state and the color is which 2012 candidate won the state.
There are several unique insights this chart provides that no other single chart does well. You can immediately tell which states Clinton won/lost, by how much, how valuable the state was to the election based on electoral college votes, and how she performed compared to Obama. Some other specific insights you can get from this chart:
- Despite winning the popular vote Clinton lost the electoral college by a wide margin due to major decreases across almost every state in democratic voting vs 2012
- Almost every state saw a decrease in democratic voting except California (voted Clinton) and Texas (voted Trump) which are the two largest states in the country
- Ohio was perhaps the most significant defeat for Clinton because it carries 18 electoral votes, Obama won the state by 3 points, and Clinton lost it by 11 points

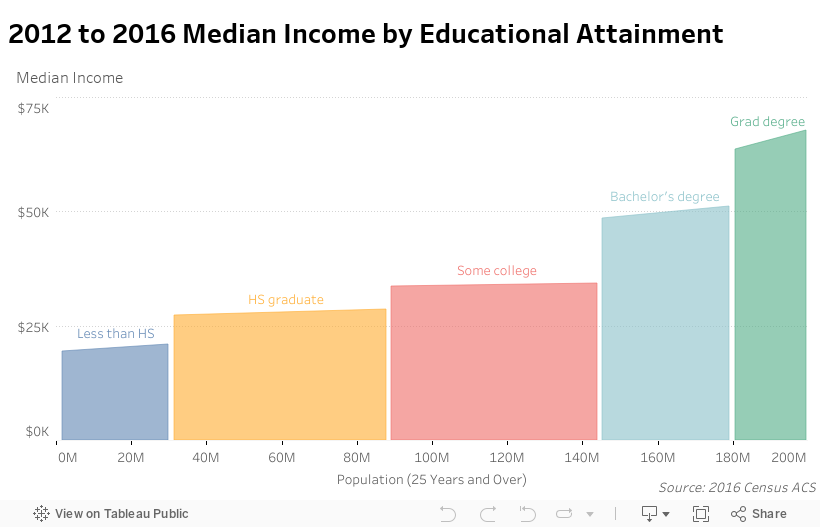
There are several unique insights you can see in this chart. In one chart you can see the general trend in income by education and how many Americans have that education. In general people with higher levels of educational attainment have a higher income. You can also see wages on average rising since 2012 across all education levels. But there was a more significant increase for those with a graduate degree. You can also see that the vast majority of Americans don't have a 4 year degree.
The final example of a Marimekko slope is a comparison of profit by product type. The height of the bar is how much profit the company made by product type. The bar width is the number of products sold. The slope is the change in profit from November to December. And the color is the product category. This is fake data from Tableau's Super Store Sales dataset.
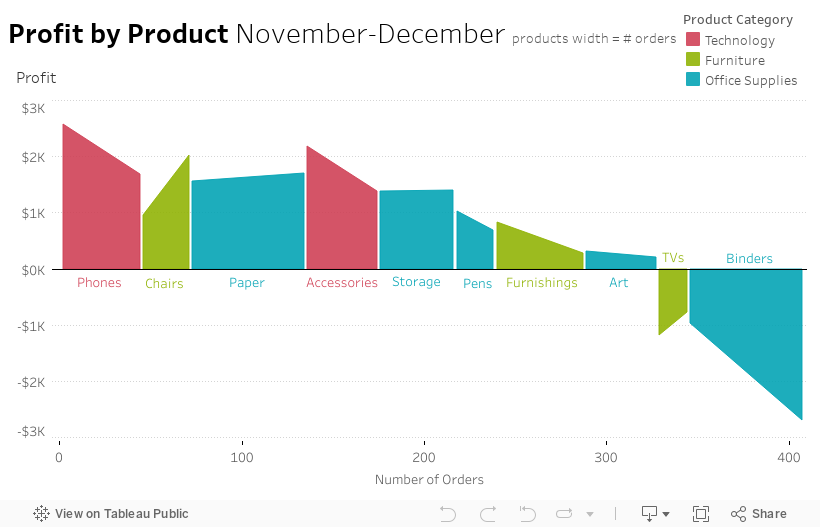
You can see that Super Store has sold a lot of paper, it is very profitable, and that profit increased over the previous month. You can also see that two products lose money for the company. Binder sales in particular are hurting the business. Super Store is selling a lot of binders but are losing money and the trend relative to last month is getting worse. Chairs might be a product to focus on selling in more places given its high profitability and positive trend but small number of orders. This is an insight you can easily see in this chart.
I think the Marimekko Slope plot has a lot of potential use cases. I will follow up with a later post about how to create this chart in Tableau. It is relatively easy to create and does not require any data pre-processing. Please let me know if you have any questions or comments. Thank you.