
Inspired by this I created a similar visualization in Tableau that achieves a similar, albeit less impressive, effect.
I used this particular piece as guidance for my design.

To create the individual analog clocks I used a similar approach
to what I did to create the gauge charts. I plotted 60 points, one for each
minute, along the perimeter of a circle. This created an X and Y
coordinate for every minute. The formula I used in Excel to create these points
was the following:
- X1 =
1 + SQRT(2) × SIN(A1 × PI() / 180)
- Y1 =
1 + SQRT(2) × COS(A1 × PI() / 180)
Where A represents an angle
between 0 and 360 at intervals of 6 or 360/60.
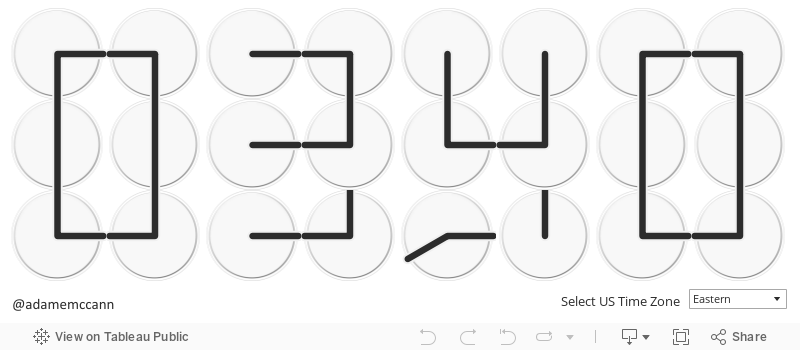
In order to create a
digital clock I need 24 individual clocks or 6 clocks each for each of the 4 digits. I created the following layout for the individual analog clocks to create the digital clock.

I then manually determined the necessary orientation of the minute hand and the
hour hand in order to create the look of a digital number. For example, the upper left corner of the digit zero (clocks 1, 7, 13, and 19) requires the
minute hand at 6 and the hour hand at 3 to create the effect of a corner. The following is the layout for all 24 clocks and 10 digits.

So for each of the 24 analog clocks and 10 digits (0-9) an X
and Y point is calculated in Excel using the formulas above. For digits with extra spaces (1 for example)
I visualize an analog clock with the actual time.
Once the data is set up in Excel and you need
to create the analog clock in Tableau. Each analog clock is essentially a gauge chart with
two arms. The chart in Tableau is a scatter plot. For a given hour or minute
two points are placed along the circumference based on the X (column shelf) and Y (row shelf) calculated above. There is also a fixed point in the center. The arm connecting
the point at the center of the clock and the circumference points is visualized
using the path shelf. A background image made to look like a clock
face is also added.

Each of the 24 analog clocks are arranged in a 3 X 8 grid to look
like a digital clock. Finally, to calculate the current hour or minute
digit every time the file is loaded I used the NOW() function in Tableau.
Hope this interesting. Post any questions in the comments above.
- Adam